Intro
In the realm of HR Analytics, understanding the patterns and factors influencing employee income is crucial for informed decision-making. This project dives into a detailed exploration of income within an HR dataset, employing various data science techniques and visualizations to extract valuable insights. My primary focus is the influence of employee demographics, job satisfaction, and work-related aspects on monthly income. Note: I did another project on this dataset located here.
The Dataset
The HR Analytics dataset from Kaggle encompasses information concerning employees, including demographics, job satisfaction, and various work-related factors.
My Code
My full notebook is on my GitHub.
Exploratory Data Analysis (EDA)
Univariate Analysis
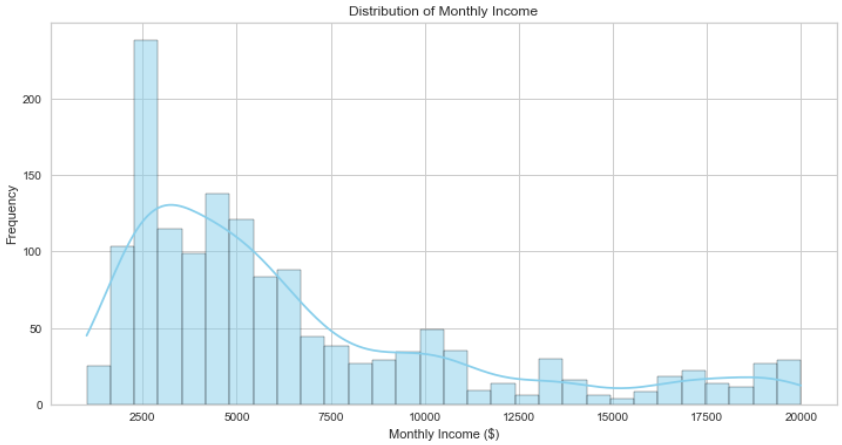
The distribution of the monthly income is examined first through a histogram, showing the overall income patterns within the organization.
Bivariate Analysis
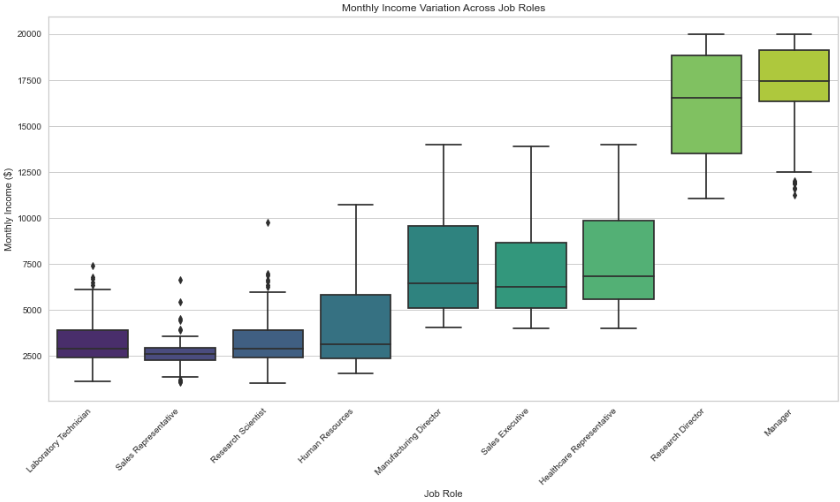
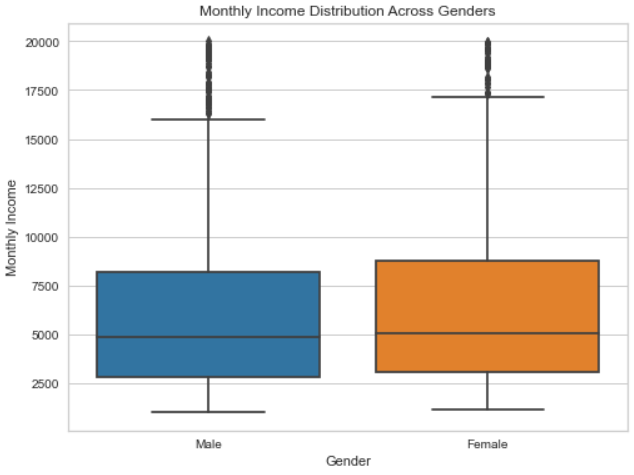
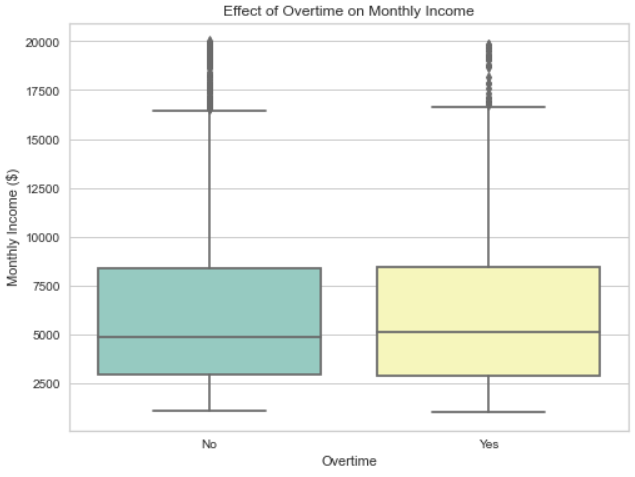
Monthly income correlations are explored through the plots below, highlighting the association between education levels and job role which were a few of the features explored.

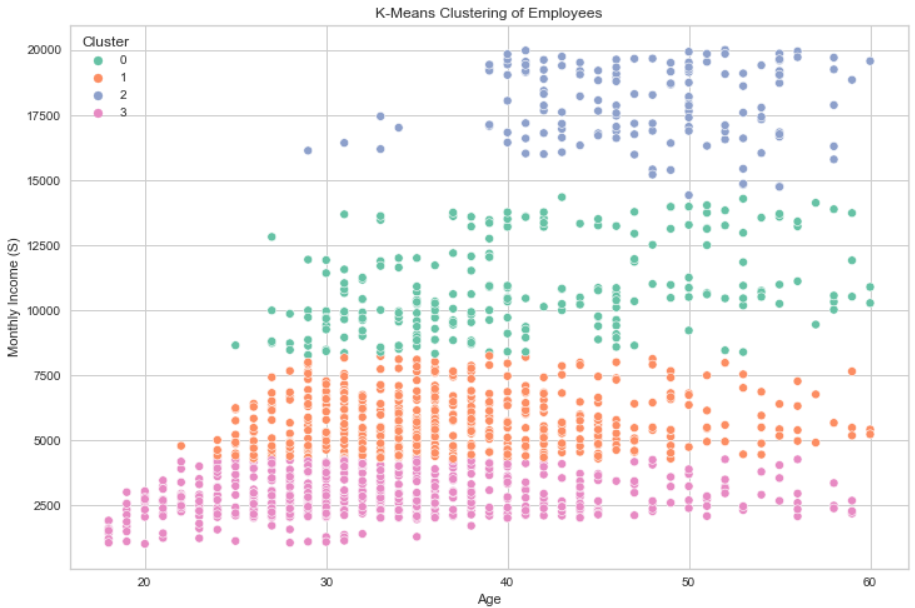
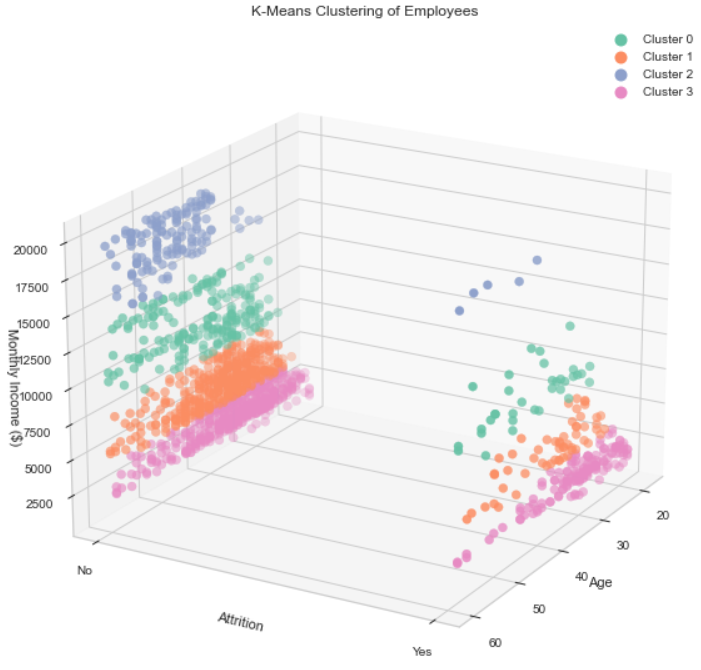
To gain a more in-depth understanding of the dataset, this project employs K-Means clustering. After encoding categorical variables, relevant columns are selected for clustering. The dataset is then standardized and subjected to the elbow method to determine the optimal number of clusters. In this case, k=4 is chosen based on the elbow method.

Cluster Analysis
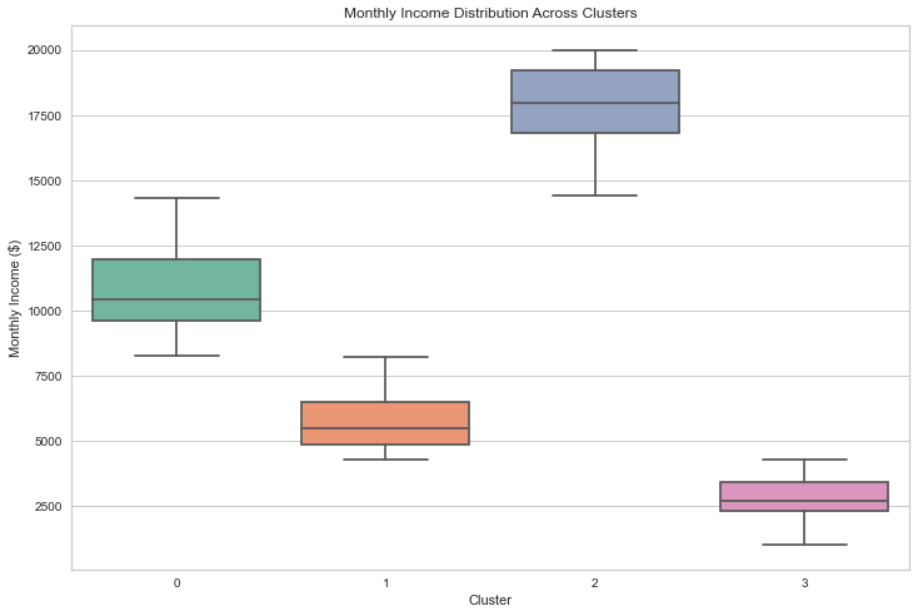
Mean features within each cluster are examined to discern the characteristics of employees in different segments.
Cluster Insights
-
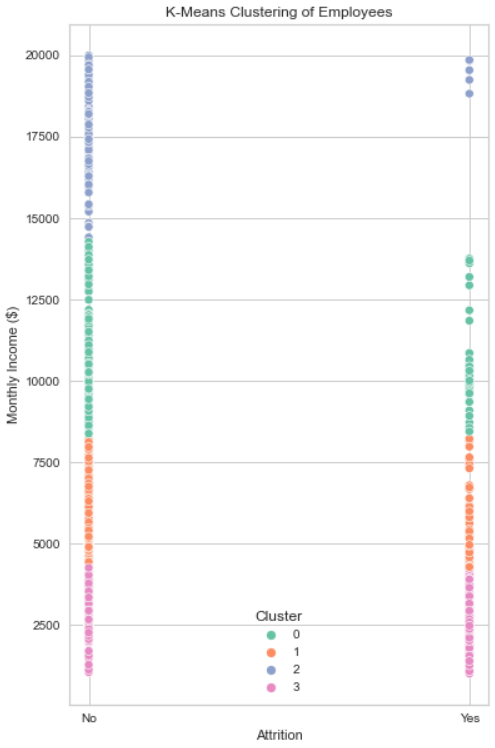
- Cluster 0: This group comprises individuals with relatively high incomes and low attrition rates, indicating a more senior and stable workforce.
-
- Cluster 1: Characterized by moderate incomes and attrition rates, this cluster represents a diverse group of employees.
-
- Cluster 2: Encompassing high income and low attrition, Cluster 2 signifies a more senior and stable employee segment.
-
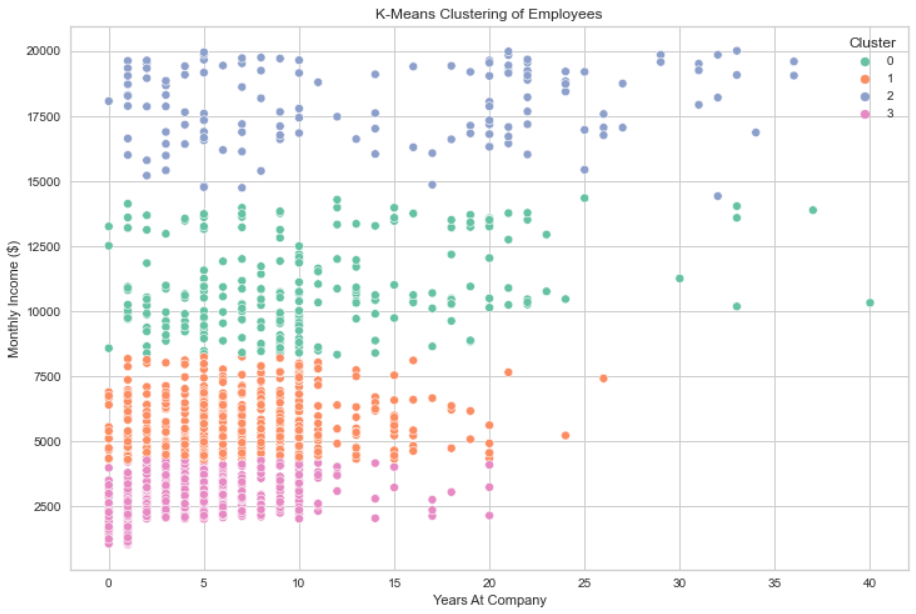
- Cluster 3: This cluster exhibits low income and high attrition, suggesting a younger and less experienced group.

Actions for Cluster 3
Implement targeted interventions for employees in Cluster 3, which was characterized by the highest attrition rate and the lowest years at the company. Conducting exit interviews to understand the reasons behind attrition and introducing measures such as career development programs, increased compensation, or improvements in work-life balance can be instrumental.
Conclusions
This project illustrates the correlation between various factors and monthly income within an organizational setting. By leveraging data science techniques, this project provides actionable insights that can empower HR professionals to formulate and implement strategic policies for employee satisfaction and retention. This analytical approach serves as a valuable tool for organizations aiming to make data-driven decisions in HR.